Statistics
Introduction
The JSLEE provides a broad spectrum of statistics to statistics monitoring systems. To provide the widest reach possible, statistics in the JSLEE are collected and configured within the JSLEE binary through Micrometer, a vendor-neutral solution for distributing metrics.
Vert.x metrics, Micrometer and modern aggregation and display solutions are sophisticated and detailed documentation on these tools is out of scope of this document.
Configuring Statistics
It is possible to control OS statistics gathering within the JSLEE, however all other statistics gathering and publishing is currently fixed. See JSLEE Configuration for configuration details of OS statistics.
Accessing Statistics
Statistics are accessed through the JSLEE console which runs by default on port 5290 on each node. To access
statistics, make an HTTP query to http://servername:5290/metrics, updating the server name as applicable.
An excerpt from a running system will include many metrics, e.g.:
...
# HELP vertx_pool_usage_seconds Time using a resource
# TYPE vertx_pool_usage_seconds summary
vertx_pool_usage_seconds_count{pool_type="worker",} 169.0
vertx_pool_usage_seconds_sum{pool_type="worker",} 1.900028425
# HELP vertx_pool_usage_seconds_max Time using a resource
# TYPE vertx_pool_usage_seconds_max gauge
vertx_pool_usage_seconds_max{pool_type="worker",} 1.660920192
...
OS and JVM Statistics
OS and JVM Statistics can be generated by the JSLEE if required. If enabled, the following statistics will be available:
Memory Statistics
| Statistic | Type | Description |
|---|---|---|
jvm_memory_max |
Gauge | The total memory the JVM has pre-allocated for use by the Java managed memory allocator. |
jvm_memory_used |
Gauge | The actual memory being used by the JSLEE for managed memory objects. |
system.memory.available |
Gauge | The total system memory available. This is tracked using OSHI. |
system.memory.total |
Gauge | The total system memory. This is tracked using OSHI. |
system.memory.used |
Gauge | The total system memory used. This is tracked using OSHI. |
system.memory.swap.total |
Gauge | The total system swap. This is tracked using OSHI. |
system.memory.swap.used |
Gauge | The total system swap used. This is tracked using OSHI. |
CPU Statistics
| Statistic | Type | Description |
|---|---|---|
system.cpu.usage.pct |
Gauge | The CPU usage as a percentage. This metric has a mode tag showing the usage type: user, system, idle, nice, irq, or softirq. |
system.load.1m |
Gauge | The average system load over the last minute. This metric has a cpus tag that gives a count of the number of CPUs available as the load requires the total CPU count to be understood. |
system.load.5m |
Gauge | The average system load over the last five minutes. This metric has a cpus tag that gives a count of the number of CPUs available as the load requires the total CPU count to be understood. |
system.load.15m |
Gauge | The average system load over the last fifteen minutes. This metric has a cpus tag that gives a count of the number of CPUs available as the load requires the total CPU count to be understood. |
system.cpu.seconds.total |
Counter | The CPU seconds used as a numeric total. This metric has a mode tag showing the usage type: user, system, idle, nice, irq, or softirq. |
Network Statistics
| Statistic | Type | Description |
|---|---|---|
system.network.bytes.received |
Counter | The total bytes received by the machine over network links. |
system.network.bytes.sent |
Counter | The total bytes received by the machine over network links. |
system.network.packets.received |
Counter | The total packet count received by the machine over network links. |
system.network.packets.sent |
Counter | The total packet count received by the machine over network links. |
JSLEE Event Bus Statistics
| Statistic | Type | Description |
|---|---|---|
n2jslee.eventbus.requests_pending |
Gauge | The number of outstanding requests the service is waiting for. Unlike core Vert.X statistics, this statistic provides both node and service breakdowns so that it is possible to see the pending queue per JSLEE service. |
n2jslee.eventbus.request_latency_ms |
Distribution | The milliseconds delay between sending a request to the Vert.X event bus and receiving a reply. This gives details on how long it takes services to wait in receiving a reply. When coupled with other statistics (such as the translator_request_latency_ms Translator statistics it is possible to monitor event bus transmission times vs. processing times in services. |
Statistics Format
Statistics are provided in the Prometheus format, which is a simple text based format with all statistics listed. A central Prometheus installation should pull statistics at regular intervals, storing and aggregating these as required in its own deployment.
Statistics Display
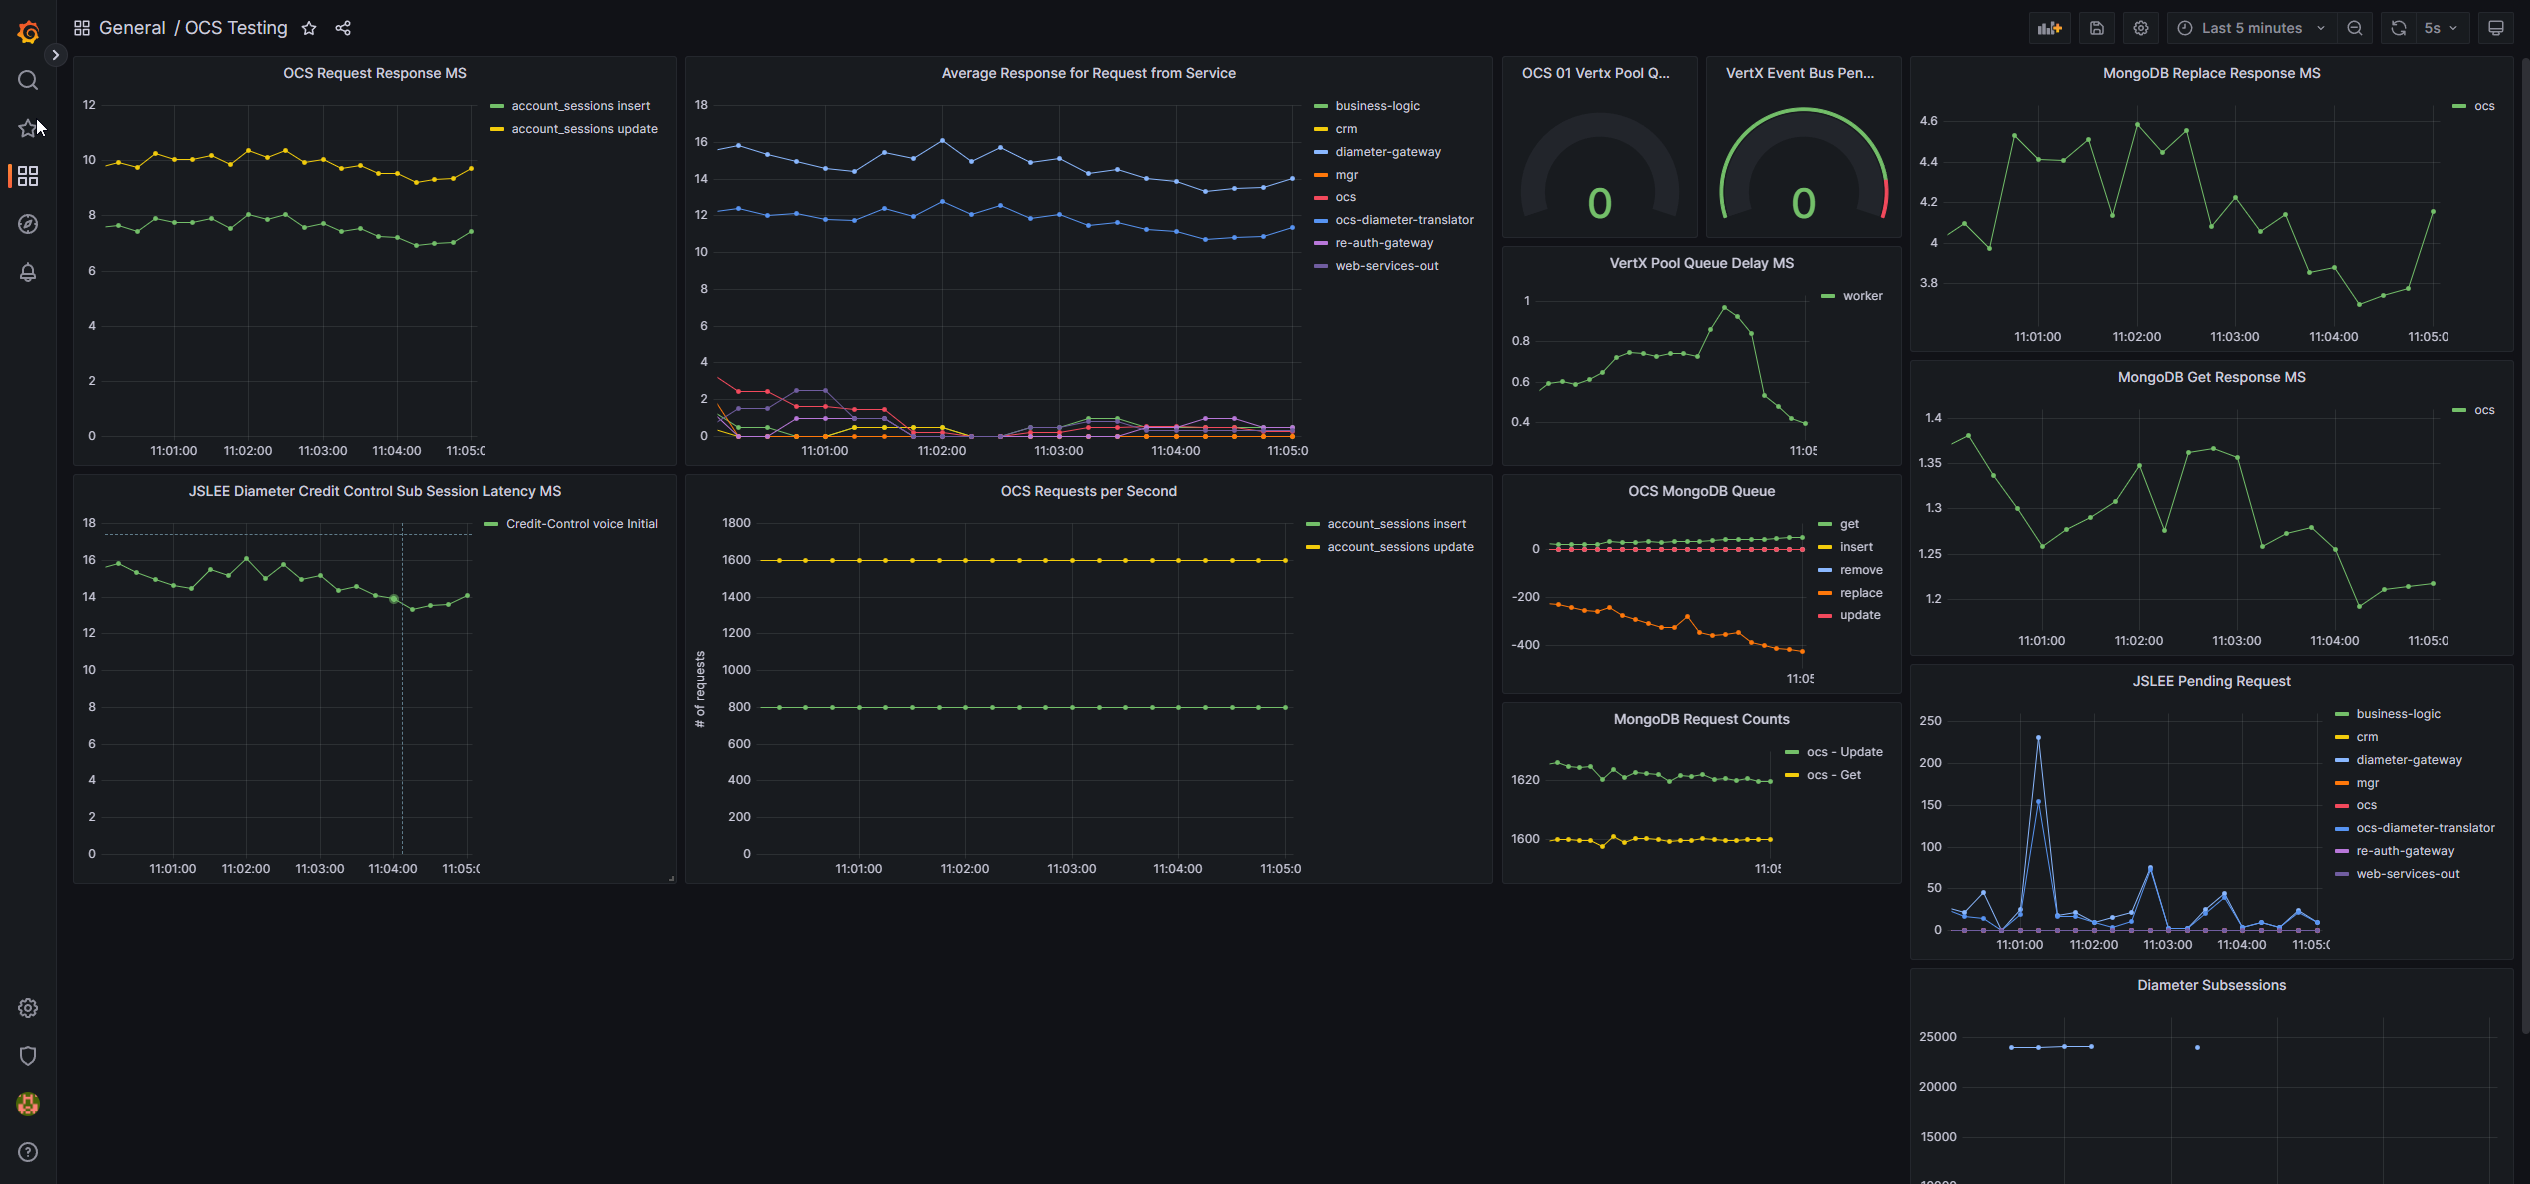
Statistical display depends on the statistics solution you are using. One option is Grafana, a highly capable web-application for the display of statistics sourced from a range of backend solutions, including Prometheus:
Example Solution Setup
Prometheus
Install Prometheus
Download Prometheus.
Untar the file:
tar xvfz prometheus-*.tar.gz
   cd prometheus-*
Configure Prometheus
Configure Prometheus by editing the YML file:
vi prometheus.yml
For easy set up use the default configuration, updating the jslee.server.address value for your JSLEE server address:
global:
  scrape_interval:     15s
  evaluation_interval: 15s

scrape_configs:
    # metrics_path defaults to '/metrics'
    # scheme defaults to 'http'.
  - job_name: prometheus
    static_configs:
      - targets: ['jslee.server.address:5290', 'localhost:9090']
Once configured, run Prometheus:
./prometheus --config.file=prometheus.yml
In a browser open the URL http://localhost:9090 to view graphs, or http://localhost:9090/metrics to view metrics.
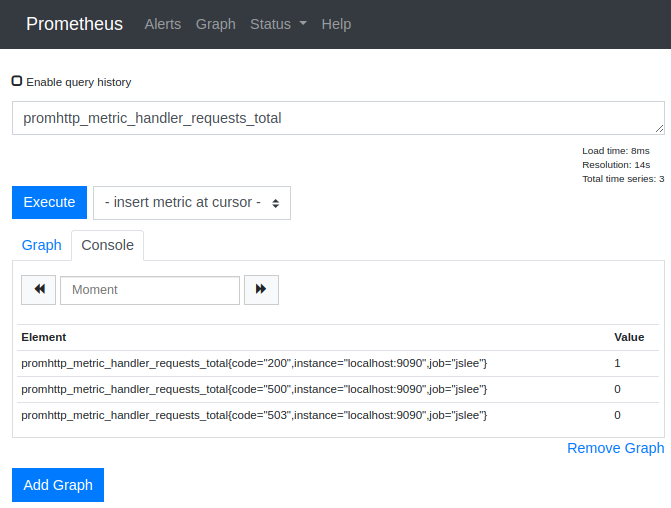
To test Prometheus, enter the query:
promhttp_metric_handler_requests_total
Select Execute, this should give you some metrics on the HTTP requests Prometheus has handled.
Grafana
Install Grafana
To install Grafana download and install via a package manager, e.g. for Debian-based installations:
wget https://dl.grafana.com/oss/release/grafana_6.0.2_amd64.deb
sudo apt-get install -y adduser libfontconfig
sudo dpkg -i grafana_6.0.2_amd64.deb
Start the Grafana service:
sudo service grafana-server start

# To configure Grafana to start on boot:
sudo update-rc.d grafana-server defaults
You can now access grafana at localhost:3000. The default login is admin/admin.
Configure a data source
Once logged into Grafana you will need to configure it to read from Prometheus, to do this:
- Select
Create your first data source - Select
Prometheus
Then add the following details:
- URL:
http://localhost:9090 - Access: Server
- Auth: <none>
- Scrape interval: 15s
- Query timeout: 60s
- HTTP Method: GET
Then select Save and test.
Add a dashboard
Select the Create your first dashboard button
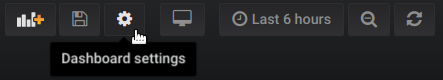
Select the Dashboard Settings button in the top right-hand corner of the new dashboard screen:
In the menu on the left hand side select JSON Model:
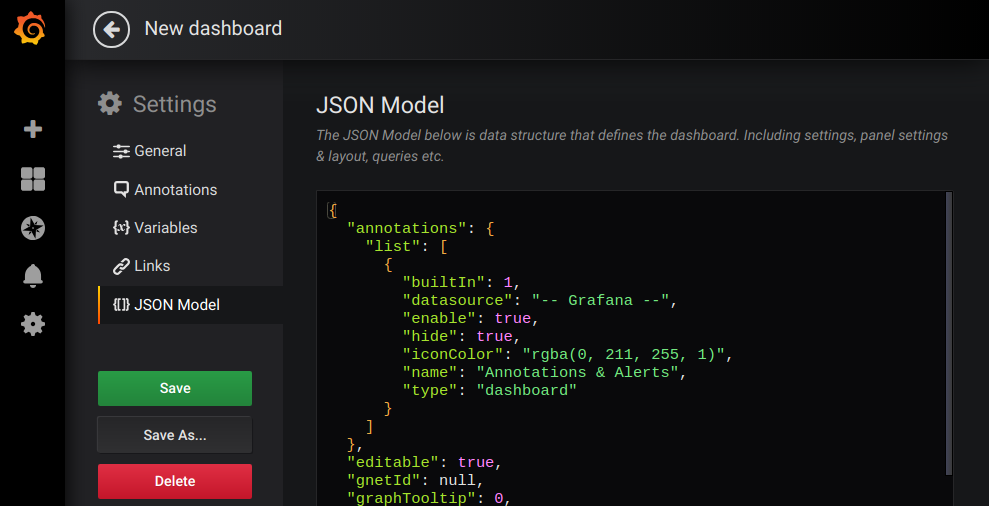
Clear the contents of the JSON edit panel and replace it with the example Micrometer Prometheus Dashboard for Grafana.
Select Save Changes.